memerald beta 3 integrin mouse addgene Search Results


94
Addgene inc murine integrin β3
(A) Stable GFP-Paxillin expressing Flp-In 3T3 cells were transiently transfected with RFP-tagged LIM1-4 or LD1-5 domains. (B) Paxillin localization at FAs was evaluated by measuring the GFP fluorescence intensity in presence of either overexpressed LIM or LD domains. Shown are mean values of GFP-intensity from three independent experiments. The total number of analysed FAs is given in brackets under each sample. Error bars represent 5 and 95 percentiles. Significance was calculated using one-way ANOVA, followed by Bonferroni Multiple Comparison Test (*** p<0.0001, ns = not significant). (C) In vitro pulldown using recombinant Twin-Strep-tag <t>integrin</t> β cytoplasmic tails and recombinant talin1 F3 domain, full length kindlin2 as well as paxillin LIM2/3 domain fused to His 6 -Sumo, or His 6 -Sumo only as negative control. (D) and (E) Solution structure of paxillin LIM2/3. The final ensemble of ten conformers with lowest target function is shown fitted to the LIM2 domain (residues P381 to F438) (D) and fitted to the LIM3-domain (residues P440 to R497) (E), shown in ribbon representations. In the fitted part, α-helices are colored cyan and β-strands magenta. Zinc ions are shown as grey spheres. The flexible loop of the LIM3 domain (residue T473 to E482) is shown in blue. The domain that was not used for fitting is shown in light grey.
Murine Integrin β3, supplied by Addgene inc, used in various techniques. Bioz Stars score: 94/100, based on 1 PubMed citations. ZERO BIAS - scores, article reviews, protocol conditions and more
https://www.bioz.com/product/memerald+beta+3+integrin+mouse+addgene/bio_rxiv__2023__01__26__525744-237-7-14?v=Addgene+inc
Average 94 stars, based on 1 article reviews
murine integrin β3 - by Bioz Stars, 2026-07
94/100 stars
  Buy from Supplier

93
Addgene inc memerald beta1 n
(A) Stable GFP-Paxillin expressing Flp-In 3T3 cells were transiently transfected with RFP-tagged LIM1-4 or LD1-5 domains. (B) Paxillin localization at FAs was evaluated by measuring the GFP fluorescence intensity in presence of either overexpressed LIM or LD domains. Shown are mean values of GFP-intensity from three independent experiments. The total number of analysed FAs is given in brackets under each sample. Error bars represent 5 and 95 percentiles. Significance was calculated using one-way ANOVA, followed by Bonferroni Multiple Comparison Test (*** p<0.0001, ns = not significant). (C) In vitro pulldown using recombinant Twin-Strep-tag <t>integrin</t> β cytoplasmic tails and recombinant talin1 F3 domain, full length kindlin2 as well as paxillin LIM2/3 domain fused to His 6 -Sumo, or His 6 -Sumo only as negative control. (D) and (E) Solution structure of paxillin LIM2/3. The final ensemble of ten conformers with lowest target function is shown fitted to the LIM2 domain (residues P381 to F438) (D) and fitted to the LIM3-domain (residues P440 to R497) (E), shown in ribbon representations. In the fitted part, α-helices are colored cyan and β-strands magenta. Zinc ions are shown as grey spheres. The flexible loop of the LIM3 domain (residue T473 to E482) is shown in blue. The domain that was not used for fitting is shown in light grey.
Memerald Beta1 N, supplied by Addgene inc, used in various techniques. Bioz Stars score: 93/100, based on 1 PubMed citations. ZERO BIAS - scores, article reviews, protocol conditions and more
https://www.bioz.com/product/memerald+beta+3+integrin+mouse+addgene/bio_rxiv__158618-76-14-6?v=Addgene+inc
Average 93 stars, based on 1 article reviews
memerald beta1 n - by Bioz Stars, 2026-07
93/100 stars
  Buy from Supplier

92
Addgene inc meos2 integrin beta3 n 18
(A) Stable GFP-Paxillin expressing Flp-In 3T3 cells were transiently transfected with RFP-tagged LIM1-4 or LD1-5 domains. (B) Paxillin localization at FAs was evaluated by measuring the GFP fluorescence intensity in presence of either overexpressed LIM or LD domains. Shown are mean values of GFP-intensity from three independent experiments. The total number of analysed FAs is given in brackets under each sample. Error bars represent 5 and 95 percentiles. Significance was calculated using one-way ANOVA, followed by Bonferroni Multiple Comparison Test (*** p<0.0001, ns = not significant). (C) In vitro pulldown using recombinant Twin-Strep-tag <t>integrin</t> β cytoplasmic tails and recombinant talin1 F3 domain, full length kindlin2 as well as paxillin LIM2/3 domain fused to His 6 -Sumo, or His 6 -Sumo only as negative control. (D) and (E) Solution structure of paxillin LIM2/3. The final ensemble of ten conformers with lowest target function is shown fitted to the LIM2 domain (residues P381 to F438) (D) and fitted to the LIM3-domain (residues P440 to R497) (E), shown in ribbon representations. In the fitted part, α-helices are colored cyan and β-strands magenta. Zinc ions are shown as grey spheres. The flexible loop of the LIM3 domain (residue T473 to E482) is shown in blue. The domain that was not used for fitting is shown in light grey.
Meos2 Integrin Beta3 N 18, supplied by Addgene inc, used in various techniques. Bioz Stars score: 92/100, based on 1 PubMed citations. ZERO BIAS - scores, article reviews, protocol conditions and more
https://www.bioz.com/product/memerald+beta+3+integrin+mouse+addgene/bio_rxiv__158618-76-10-6?v=Addgene+inc
Average 92 stars, based on 1 article reviews
meos2 integrin beta3 n 18 - by Bioz Stars, 2026-07
92/100 stars
  Buy from Supplier

93
Addgene inc memerald alpha v integrin n 25
(A) Stable GFP-Paxillin expressing Flp-In 3T3 cells were transiently transfected with RFP-tagged LIM1-4 or LD1-5 domains. (B) Paxillin localization at FAs was evaluated by measuring the GFP fluorescence intensity in presence of either overexpressed LIM or LD domains. Shown are mean values of GFP-intensity from three independent experiments. The total number of analysed FAs is given in brackets under each sample. Error bars represent 5 and 95 percentiles. Significance was calculated using one-way ANOVA, followed by Bonferroni Multiple Comparison Test (*** p<0.0001, ns = not significant). (C) In vitro pulldown using recombinant Twin-Strep-tag <t>integrin</t> β cytoplasmic tails and recombinant talin1 F3 domain, full length kindlin2 as well as paxillin LIM2/3 domain fused to His 6 -Sumo, or His 6 -Sumo only as negative control. (D) and (E) Solution structure of paxillin LIM2/3. The final ensemble of ten conformers with lowest target function is shown fitted to the LIM2 domain (residues P381 to F438) (D) and fitted to the LIM3-domain (residues P440 to R497) (E), shown in ribbon representations. In the fitted part, α-helices are colored cyan and β-strands magenta. Zinc ions are shown as grey spheres. The flexible loop of the LIM3 domain (residue T473 to E482) is shown in blue. The domain that was not used for fitting is shown in light grey.
Memerald Alpha V Integrin N 25, supplied by Addgene inc, used in various techniques. Bioz Stars score: 93/100, based on 1 PubMed citations. ZERO BIAS - scores, article reviews, protocol conditions and more
https://www.bioz.com/product/memerald+beta+3+integrin+mouse+addgene/bio_rxiv__158618-76-9-6?v=Addgene+inc
Average 93 stars, based on 1 article reviews
memerald alpha v integrin n 25 - by Bioz Stars, 2026-07
93/100 stars
  Buy from Supplier

86
Addgene inc memerald alpha5 integrin 12
(A) Stable GFP-Paxillin expressing Flp-In 3T3 cells were transiently transfected with RFP-tagged LIM1-4 or LD1-5 domains. (B) Paxillin localization at FAs was evaluated by measuring the GFP fluorescence intensity in presence of either overexpressed LIM or LD domains. Shown are mean values of GFP-intensity from three independent experiments. The total number of analysed FAs is given in brackets under each sample. Error bars represent 5 and 95 percentiles. Significance was calculated using one-way ANOVA, followed by Bonferroni Multiple Comparison Test (*** p<0.0001, ns = not significant). (C) In vitro pulldown using recombinant Twin-Strep-tag <t>integrin</t> β cytoplasmic tails and recombinant talin1 F3 domain, full length kindlin2 as well as paxillin LIM2/3 domain fused to His 6 -Sumo, or His 6 -Sumo only as negative control. (D) and (E) Solution structure of paxillin LIM2/3. The final ensemble of ten conformers with lowest target function is shown fitted to the LIM2 domain (residues P381 to F438) (D) and fitted to the LIM3-domain (residues P440 to R497) (E), shown in ribbon representations. In the fitted part, α-helices are colored cyan and β-strands magenta. Zinc ions are shown as grey spheres. The flexible loop of the LIM3 domain (residue T473 to E482) is shown in blue. The domain that was not used for fitting is shown in light grey.
Memerald Alpha5 Integrin 12, supplied by Addgene inc, used in various techniques. Bioz Stars score: 86/100, based on 1 PubMed citations. ZERO BIAS - scores, article reviews, protocol conditions and more
https://www.bioz.com/product/memerald+beta+3+integrin+mouse+addgene/bio_rxiv__158618-76-12-6?v=Addgene+inc
Average 86 stars, based on 1 article reviews
memerald alpha5 integrin 12 - by Bioz Stars, 2026-07
86/100 stars
  Buy from Supplier

86
Addgene inc meos2 alpha v integrin n 25
(A) Stable GFP-Paxillin expressing Flp-In 3T3 cells were transiently transfected with RFP-tagged LIM1-4 or LD1-5 domains. (B) Paxillin localization at FAs was evaluated by measuring the GFP fluorescence intensity in presence of either overexpressed LIM or LD domains. Shown are mean values of GFP-intensity from three independent experiments. The total number of analysed FAs is given in brackets under each sample. Error bars represent 5 and 95 percentiles. Significance was calculated using one-way ANOVA, followed by Bonferroni Multiple Comparison Test (*** p<0.0001, ns = not significant). (C) In vitro pulldown using recombinant Twin-Strep-tag <t>integrin</t> β cytoplasmic tails and recombinant talin1 F3 domain, full length kindlin2 as well as paxillin LIM2/3 domain fused to His 6 -Sumo, or His 6 -Sumo only as negative control. (D) and (E) Solution structure of paxillin LIM2/3. The final ensemble of ten conformers with lowest target function is shown fitted to the LIM2 domain (residues P381 to F438) (D) and fitted to the LIM3-domain (residues P440 to R497) (E), shown in ribbon representations. In the fitted part, α-helices are colored cyan and β-strands magenta. Zinc ions are shown as grey spheres. The flexible loop of the LIM3 domain (residue T473 to E482) is shown in blue. The domain that was not used for fitting is shown in light grey.
Meos2 Alpha V Integrin N 25, supplied by Addgene inc, used in various techniques. Bioz Stars score: 86/100, based on 1 PubMed citations. ZERO BIAS - scores, article reviews, protocol conditions and more
https://www.bioz.com/product/memerald+beta+3+integrin+mouse+addgene/bio_rxiv__158618-76-8-6?v=Addgene+inc
Average 86 stars, based on 1 article reviews
meos2 alpha v integrin n 25 - by Bioz Stars, 2026-07
86/100 stars
  Buy from Supplier

95
Addgene inc retroviral constructs
(A) Stable GFP-Paxillin expressing Flp-In 3T3 cells were transiently transfected with RFP-tagged LIM1-4 or LD1-5 domains. (B) Paxillin localization at FAs was evaluated by measuring the GFP fluorescence intensity in presence of either overexpressed LIM or LD domains. Shown are mean values of GFP-intensity from three independent experiments. The total number of analysed FAs is given in brackets under each sample. Error bars represent 5 and 95 percentiles. Significance was calculated using one-way ANOVA, followed by Bonferroni Multiple Comparison Test (*** p<0.0001, ns = not significant). (C) In vitro pulldown using recombinant Twin-Strep-tag <t>integrin</t> β cytoplasmic tails and recombinant talin1 F3 domain, full length kindlin2 as well as paxillin LIM2/3 domain fused to His 6 -Sumo, or His 6 -Sumo only as negative control. (D) and (E) Solution structure of paxillin LIM2/3. The final ensemble of ten conformers with lowest target function is shown fitted to the LIM2 domain (residues P381 to F438) (D) and fitted to the LIM3-domain (residues P440 to R497) (E), shown in ribbon representations. In the fitted part, α-helices are colored cyan and β-strands magenta. Zinc ions are shown as grey spheres. The flexible loop of the LIM3 domain (residue T473 to E482) is shown in blue. The domain that was not used for fitting is shown in light grey.
Retroviral Constructs, supplied by Addgene inc, used in various techniques. Bioz Stars score: 95/100, based on 1 PubMed citations. ZERO BIAS - scores, article reviews, protocol conditions and more
https://www.bioz.com/product/memerald+beta+3+integrin+mouse+addgene/pm38889096-190-21-33?v=Addgene+inc
Average 95 stars, based on 1 article reviews
retroviral constructs - by Bioz Stars, 2026-07
95/100 stars
  Buy from Supplier

93
Addgene inc pegfp vinculin
Figure 3. Th1 cells form FAs. (A–D) Representative migrating Th1 cells expressing Talin-EGFP in confinement on (A) ICAM-1, (B) FN, (C) PLL, and (D) PLL- PEG. (E) Representative image of a confined Th1 cell fixed and stained for endogenous talin. (F and G) Quantification of the number of FA-positive cells when expressing (F) Talin-EGFP or (G) <t>vinculin-EGFP</t> compared across surface treatments. (H) A comparison of FA lifetime between Th1 cells and fibroblasts ex- pressing Vinculin eGFP (representative images on right). (I and J) Representative Th1 cells expressing (I) Talin-EGFP or (J) Integrin β3-Emerald in confinement on a micropatterned substrate. The left portion of the field of view is FN coated and the right portion is passivated. Number of biological replicates (colored dots): (F) Passivated, 36 cells from three experiments; PLL, 53 cells from two experiments; FN, 140 cells from five experiments; ICAM-1, 40 cells from three ex- periments. (G) Passivated, 21 cells from two experiments; PLL, 38 cells from four experiments; FN, 94 cells from four experiments; ICAM-1 169 cells from three experiments. (H) Th1 n = 10; Fibroblast n = 10. Each replicate represents the average turnover of ≥5 FAs per cell. Statistical tests: (F–H) Two-tail unpaired parametric t test was used to compare the replicates.
Pegfp Vinculin, supplied by Addgene inc, used in various techniques. Bioz Stars score: 93/100, based on 1 PubMed citations. ZERO BIAS - scores, article reviews, protocol conditions and more
https://www.bioz.com/product/memerald+beta+3+integrin+mouse+addgene/pm38889096-190-49-52?v=Addgene+inc
Average 93 stars, based on 1 article reviews
pegfp vinculin - by Bioz Stars, 2026-07
93/100 stars
  Buy from Supplier

93
Addgene inc vinculin egfp
Figure 3. Th1 cells form FAs. (A–D) Representative migrating Th1 cells expressing Talin-EGFP in confinement on (A) ICAM-1, (B) FN, (C) PLL, and (D) PLL- PEG. (E) Representative image of a confined Th1 cell fixed and stained for endogenous talin. (F and G) Quantification of the number of FA-positive cells when expressing (F) Talin-EGFP or (G) <t>vinculin-EGFP</t> compared across surface treatments. (H) A comparison of FA lifetime between Th1 cells and fibroblasts ex- pressing Vinculin eGFP (representative images on right). (I and J) Representative Th1 cells expressing (I) Talin-EGFP or (J) Integrin β3-Emerald in confinement on a micropatterned substrate. The left portion of the field of view is FN coated and the right portion is passivated. Number of biological replicates (colored dots): (F) Passivated, 36 cells from three experiments; PLL, 53 cells from two experiments; FN, 140 cells from five experiments; ICAM-1, 40 cells from three ex- periments. (G) Passivated, 21 cells from two experiments; PLL, 38 cells from four experiments; FN, 94 cells from four experiments; ICAM-1 169 cells from three experiments. (H) Th1 n = 10; Fibroblast n = 10. Each replicate represents the average turnover of ≥5 FAs per cell. Statistical tests: (F–H) Two-tail unpaired parametric t test was used to compare the replicates.
Vinculin Egfp, supplied by Addgene inc, used in various techniques. Bioz Stars score: 93/100, based on 1 PubMed citations. ZERO BIAS - scores, article reviews, protocol conditions and more
https://www.bioz.com/product/memerald+beta+3+integrin+mouse+addgene/pm38889096-190-28-33?v=Addgene+inc
Average 93 stars, based on 1 article reviews
vinculin egfp - by Bioz Stars, 2026-07
93/100 stars
  Buy from Supplier

93
Addgene inc gfp talin1
Figure 3. Th1 cells form FAs. (A–D) Representative migrating Th1 cells expressing Talin-EGFP in confinement on (A) ICAM-1, (B) FN, (C) PLL, and (D) PLL- PEG. (E) Representative image of a confined Th1 cell fixed and stained for endogenous talin. (F and G) Quantification of the number of FA-positive cells when expressing (F) Talin-EGFP or (G) <t>vinculin-EGFP</t> compared across surface treatments. (H) A comparison of FA lifetime between Th1 cells and fibroblasts ex- pressing Vinculin eGFP (representative images on right). (I and J) Representative Th1 cells expressing (I) Talin-EGFP or (J) Integrin β3-Emerald in confinement on a micropatterned substrate. The left portion of the field of view is FN coated and the right portion is passivated. Number of biological replicates (colored dots): (F) Passivated, 36 cells from three experiments; PLL, 53 cells from two experiments; FN, 140 cells from five experiments; ICAM-1, 40 cells from three ex- periments. (G) Passivated, 21 cells from two experiments; PLL, 38 cells from four experiments; FN, 94 cells from four experiments; ICAM-1 169 cells from three experiments. (H) Th1 n = 10; Fibroblast n = 10. Each replicate represents the average turnover of ≥5 FAs per cell. Statistical tests: (F–H) Two-tail unpaired parametric t test was used to compare the replicates.
Gfp Talin1, supplied by Addgene inc, used in various techniques. Bioz Stars score: 93/100, based on 1 PubMed citations. ZERO BIAS - scores, article reviews, protocol conditions and more
https://www.bioz.com/product/memerald+beta+3+integrin+mouse+addgene/pm38889096-190-67-69?v=Addgene+inc
Average 93 stars, based on 1 article reviews
gfp talin1 - by Bioz Stars, 2026-07
93/100 stars
  Buy from Supplier

95
Bio X Cell be0055
KEY RESOURCES TABLE
Be0055, supplied by Bio X Cell, used in various techniques. Bioz Stars score: 95/100, based on 1 PubMed citations. ZERO BIAS - scores, article reviews, protocol conditions and more
https://www.bioz.com/product/memerald+beta+3+integrin+mouse+addgene/pmc06904228-891-31-27?v=Bio+X+Cell
Average 95 stars, based on 1 article reviews
be0055 - by Bioz Stars, 2026-07
95/100 stars
  Buy from Supplier

93
Addgene inc tib
KEY RESOURCES TABLE
Tib, supplied by Addgene inc, used in various techniques. Bioz Stars score: 93/100, based on 1 PubMed citations. ZERO BIAS - scores, article reviews, protocol conditions and more
https://www.bioz.com/product/memerald+beta+3+integrin+mouse+addgene/pm31399281-216-30-65?v=Addgene+inc
Average 93 stars, based on 1 article reviews
tib - by Bioz Stars, 2026-07
93/100 stars
  Buy from Supplier

Image Search Results


(A) Stable GFP-Paxillin expressing Flp-In 3T3 cells were transiently transfected with RFP-tagged LIM1-4 or LD1-5 domains. (B) Paxillin localization at FAs was evaluated by measuring the GFP fluorescence intensity in presence of either overexpressed LIM or LD domains. Shown are mean values of GFP-intensity from three independent experiments. The total number of analysed FAs is given in brackets under each sample. Error bars represent 5 and 95 percentiles. Significance was calculated using one-way ANOVA, followed by Bonferroni Multiple Comparison Test (*** p<0.0001, ns = not significant). (C) In vitro pulldown using recombinant Twin-Strep-tag integrin β cytoplasmic tails and recombinant talin1 F3 domain, full length kindlin2 as well as paxillin LIM2/3 domain fused to His 6 -Sumo, or His 6 -Sumo only as negative control. (D) and (E) Solution structure of paxillin LIM2/3. The final ensemble of ten conformers with lowest target function is shown fitted to the LIM2 domain (residues P381 to F438) (D) and fitted to the LIM3-domain (residues P440 to R497) (E), shown in ribbon representations. In the fitted part, α-helices are colored cyan and β-strands magenta. Zinc ions are shown as grey spheres. The flexible loop of the LIM3 domain (residue T473 to E482) is shown in blue. The domain that was not used for fitting is shown in light grey.

Journal: bioRxiv

Article Title: A flexible loop in the paxillin LIM3 domain mediates direct binding to integrin β3

doi: 10.1101/2023.01.26.525744

Figure Lengend Snippet: (A) Stable GFP-Paxillin expressing Flp-In 3T3 cells were transiently transfected with RFP-tagged LIM1-4 or LD1-5 domains. (B) Paxillin localization at FAs was evaluated by measuring the GFP fluorescence intensity in presence of either overexpressed LIM or LD domains. Shown are mean values of GFP-intensity from three independent experiments. The total number of analysed FAs is given in brackets under each sample. Error bars represent 5 and 95 percentiles. Significance was calculated using one-way ANOVA, followed by Bonferroni Multiple Comparison Test (*** p<0.0001, ns = not significant). (C) In vitro pulldown using recombinant Twin-Strep-tag integrin β cytoplasmic tails and recombinant talin1 F3 domain, full length kindlin2 as well as paxillin LIM2/3 domain fused to His 6 -Sumo, or His 6 -Sumo only as negative control. (D) and (E) Solution structure of paxillin LIM2/3. The final ensemble of ten conformers with lowest target function is shown fitted to the LIM2 domain (residues P381 to F438) (D) and fitted to the LIM3-domain (residues P440 to R497) (E), shown in ribbon representations. In the fitted part, α-helices are colored cyan and β-strands magenta. Zinc ions are shown as grey spheres. The flexible loop of the LIM3 domain (residue T473 to E482) is shown in blue. The domain that was not used for fitting is shown in light grey.

Article Snippet: For complementation of integrin β3, cDNA of murine integrin β3 (gift from Michael Davidson, addgene plasmid # 54130) was amplified by PCR using the following primers mITGB3 forward: 5’-GATGACACTAGTGACCGCCATGCGAGCGCAGTG-3’ and mITGB3-fl reverse: 5’-TCGGCAGCCCTCGAGCTAAGTCCCCCGGTAGGTGATATTG-3’; mITGB3 forward and mITGB3∆8aa reverse: 5’-TCGGCAGCCCTCGAGCTAGAAGGTGGAGGTGGCCTCTTTATAC-3’; mITGB3 forward and mITGB3∆3aa reverse: 5’-TCGGCAGCCCTCGAGCTAGTAGGTGATATTGGTGAAGGTGGAGGTG-3’.

Techniques: Expressing, Transfection, Fluorescence, Comparison, In Vitro, Recombinant, Strep-tag, Negative Control, Residue

(A) 15 N-HSQC titration of 300 µM 15 N integrin β3 ct (ITGB3 ct) with paxillin LIM2/3. Paxillin was added in concentrations up to 900 µM. Boxes show a selection of signals affected by CSPs (residues N782, I783 & R786) in the presence of 0 µM (black), 150 µM (green), 300 µM (blue) and 900 µM (red) paxillin LIM2/3. Insets show the concentration dependence of combined amide CSPs globally fitted to a one site binding model. (B) Combined amide CSPs of 300 µM 15 N integrin β3 ct in the presence of 760 µM paxillin LIM2/3 vs residue number of integrin β3 ct. Lines indicate average δΔ + 1x s.d. (yellow), δΔ + 2x s.d. (orange) and δΔ + 3x s.d. (red). (C) Representative Western Blot of in vitro pulldown using biotinylated integrin β peptides and recombinant His 6 -SUMO or His 6 -SUMO-paxillin LIM2/3 (PXN LIM2/3). A decreased binding of paxillin to truncated integrin β3 peptides is visible. Lower panel: Densitometric quantification of the Western Blots in (A) (n=3). Statistical significance was calculated using One sample t-test to calculate if samples mean are significantly different from a hypothetical value of 1 (* p<0.05, ** p< 0.01). (D) 15 N-HSQC titration of 300 µM 15 N integrin β3 ∆3aa (ITGB3 ∆3aa) with paxillin LIM2/3 (PXN LIM2/3). Paxillin was added up to a concentration of 750 µM. (E) Combined amide CSPs of 300 µM 15 N integrin β3 ct ∆3aa in the presence of 750 µM paxillin LIM2/3 vs residue number of integrin β3 ct ∆3aa.

Journal: bioRxiv

Article Title: A flexible loop in the paxillin LIM3 domain mediates direct binding to integrin β3

doi: 10.1101/2023.01.26.525744

Figure Lengend Snippet: (A) 15 N-HSQC titration of 300 µM 15 N integrin β3 ct (ITGB3 ct) with paxillin LIM2/3. Paxillin was added in concentrations up to 900 µM. Boxes show a selection of signals affected by CSPs (residues N782, I783 & R786) in the presence of 0 µM (black), 150 µM (green), 300 µM (blue) and 900 µM (red) paxillin LIM2/3. Insets show the concentration dependence of combined amide CSPs globally fitted to a one site binding model. (B) Combined amide CSPs of 300 µM 15 N integrin β3 ct in the presence of 760 µM paxillin LIM2/3 vs residue number of integrin β3 ct. Lines indicate average δΔ + 1x s.d. (yellow), δΔ + 2x s.d. (orange) and δΔ + 3x s.d. (red). (C) Representative Western Blot of in vitro pulldown using biotinylated integrin β peptides and recombinant His 6 -SUMO or His 6 -SUMO-paxillin LIM2/3 (PXN LIM2/3). A decreased binding of paxillin to truncated integrin β3 peptides is visible. Lower panel: Densitometric quantification of the Western Blots in (A) (n=3). Statistical significance was calculated using One sample t-test to calculate if samples mean are significantly different from a hypothetical value of 1 (* p<0.05, ** p< 0.01). (D) 15 N-HSQC titration of 300 µM 15 N integrin β3 ∆3aa (ITGB3 ∆3aa) with paxillin LIM2/3 (PXN LIM2/3). Paxillin was added up to a concentration of 750 µM. (E) Combined amide CSPs of 300 µM 15 N integrin β3 ct ∆3aa in the presence of 750 µM paxillin LIM2/3 vs residue number of integrin β3 ct ∆3aa.

Article Snippet: For complementation of integrin β3, cDNA of murine integrin β3 (gift from Michael Davidson, addgene plasmid # 54130) was amplified by PCR using the following primers mITGB3 forward: 5’-GATGACACTAGTGACCGCCATGCGAGCGCAGTG-3’ and mITGB3-fl reverse: 5’-TCGGCAGCCCTCGAGCTAAGTCCCCCGGTAGGTGATATTG-3’; mITGB3 forward and mITGB3∆8aa reverse: 5’-TCGGCAGCCCTCGAGCTAGAAGGTGGAGGTGGCCTCTTTATAC-3’; mITGB3 forward and mITGB3∆3aa reverse: 5’-TCGGCAGCCCTCGAGCTAGTAGGTGATATTGGTGAAGGTGGAGGTG-3’.

Techniques: Titration, Selection, Concentration Assay, Binding Assay, Residue, Western Blot, In Vitro, Recombinant
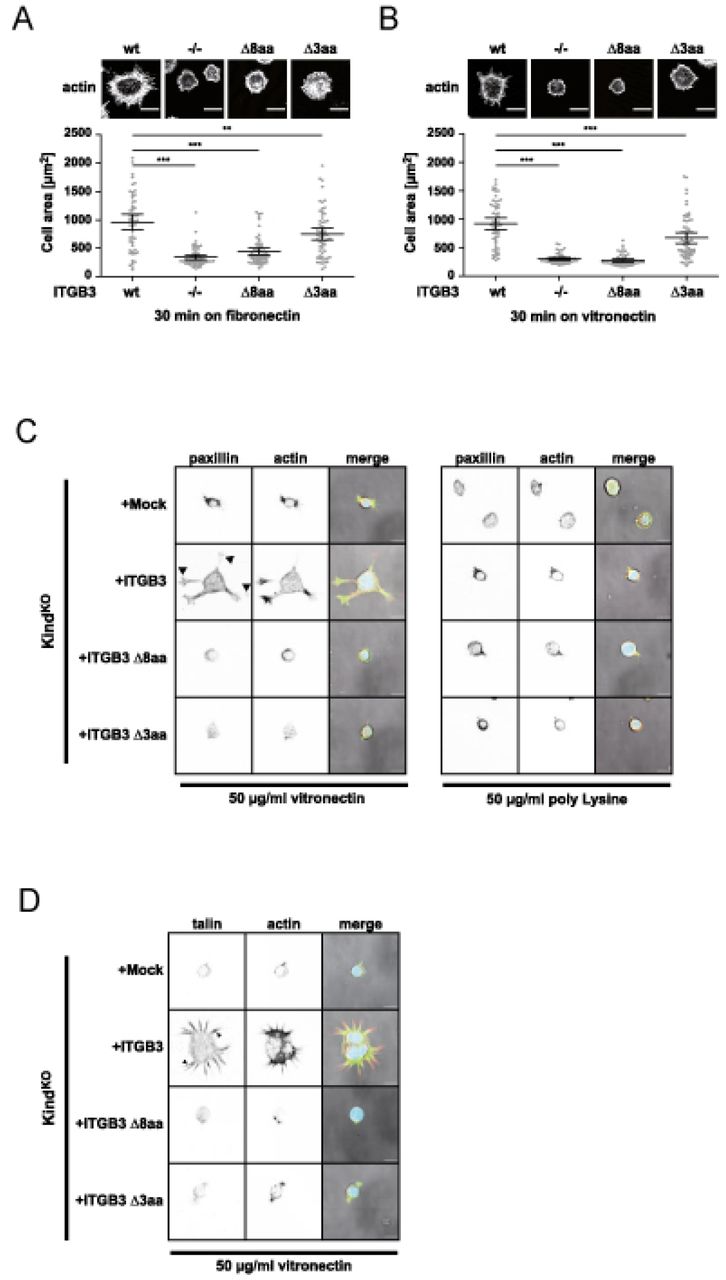
(A) and (B) Serum starved Flp-In 3T3 integrin β3 knockout fibroblasts or knockout cells re-expressing integrin β3 wt or C-terminally truncated integrin β3 mutants were seeded onto glass slides coated with 5 µg/ml fibronectin (A) or 5 µg/ml vitronectin (B) for 30 min and cell area was measured. Shown are mean values and 95% confidence intervals of n=60 cells per sample from 3 independent experiments. Statistical significance was calculated using one-way ANOVA followed by Bonferroni Multiple Comparison Test. (C) Serum starved kindlin1/2 deficient fibroblasts (Kind KO ) cells stably expressing full length integrin β3 or truncated mutants were seeded on glass coverslips coated with 50 µg/ml vitronectin (left panel) or poly-Lysin (right panel) for 4 h. Cells were fixed and stained for endogenous paxillin. (D) Serum starved Kind KO cells stably expressing full length integrin β3 or truncated mutants were seeded on glass coverslips coated with 50 µg/ml vitronectin for 4 h. Cells were fixed and stained for endogenous talin.

Journal: bioRxiv

Article Title: A flexible loop in the paxillin LIM3 domain mediates direct binding to integrin β3

doi: 10.1101/2023.01.26.525744

Figure Lengend Snippet: (A) and (B) Serum starved Flp-In 3T3 integrin β3 knockout fibroblasts or knockout cells re-expressing integrin β3 wt or C-terminally truncated integrin β3 mutants were seeded onto glass slides coated with 5 µg/ml fibronectin (A) or 5 µg/ml vitronectin (B) for 30 min and cell area was measured. Shown are mean values and 95% confidence intervals of n=60 cells per sample from 3 independent experiments. Statistical significance was calculated using one-way ANOVA followed by Bonferroni Multiple Comparison Test. (C) Serum starved kindlin1/2 deficient fibroblasts (Kind KO ) cells stably expressing full length integrin β3 or truncated mutants were seeded on glass coverslips coated with 50 µg/ml vitronectin (left panel) or poly-Lysin (right panel) for 4 h. Cells were fixed and stained for endogenous paxillin. (D) Serum starved Kind KO cells stably expressing full length integrin β3 or truncated mutants were seeded on glass coverslips coated with 50 µg/ml vitronectin for 4 h. Cells were fixed and stained for endogenous talin.

Article Snippet: For complementation of integrin β3, cDNA of murine integrin β3 (gift from Michael Davidson, addgene plasmid # 54130) was amplified by PCR using the following primers mITGB3 forward: 5’-GATGACACTAGTGACCGCCATGCGAGCGCAGTG-3’ and mITGB3-fl reverse: 5’-TCGGCAGCCCTCGAGCTAAGTCCCCCGGTAGGTGATATTG-3’; mITGB3 forward and mITGB3∆8aa reverse: 5’-TCGGCAGCCCTCGAGCTAGAAGGTGGAGGTGGCCTCTTTATAC-3’; mITGB3 forward and mITGB3∆3aa reverse: 5’-TCGGCAGCCCTCGAGCTAGTAGGTGATATTGGTGAAGGTGGAGGTG-3’.

Techniques: Knock-Out, Expressing, Comparison, Stable Transfection, Staining

( A) Mapping of combined amide CSPs when binding to integrin β3 onto the solution structure of paxillin LIM2/3 shown as surface representation from two perspectives. Residues showing CSPs larger than average δΔ + 3x s.d. are colored red, residues for which [average δΔ + 3x s.d. < δΔ < average δΔ +2x s.d.] are colored orange, and residues for which [average δΔ + 2x s.d.< δΔ < average δΔ + 1x s.d.] are colored yellow. Residues with δΔ < average + 1x s.d. are colored grey. The boxed region is also shown in stick representation including the flexible loop of the LIM3 domain using the same color code. Residues experiencing significant CSPs are labelled by amino acid type and position. (B) Combined amide CSPs of 250 µM 15 N paxillin LIM2/3 in the presence of 750 µM integrin β3 vs residue number of paxillin. Lines indicate average δΔ + 1x s.d. (yellow), δΔ + 2x s.d. (orange) and δΔ + 3x s.d. (red). (C) 15 N-HSQC titration of 250 µM 15 N paxillin LIM2/3 wt (PXN LIM2/3 wt) with integrin β3. Integrin was added in concentrations up to 2420 µM. Boxes show a selection of signals affected by CSPs (residues F480 & F481) in the presence of 0 µM (black), 200 µM (green), 600 µM (blue) and 2420 µM (red) integrin β3 ct. (D) Recombinantly expressed His 6 -SUMO PXN LIM2/3 wt or His 6 -SUMO PXN LIM2/3 4A were pulled down using Twin-Strep-Tag integrin β3 ct. PXN LIM2/3 4A shows reduced binding to integrin β3 ct. (E) Outside-in signalling dependent cell spreading of paxillin knockout cells, stably re-expressing ctrl vector (PXN KO), GFP-paxillin wt (PXN wt) or paxillin mutants PXN ∆LIM4 and PXN-4A. Cells were starved overnight and seeded for 30 or 120 min, respectively on the integrin β3 ligand vitronectin in the absence of serum. Cells were fixed and the cell membrane was stained with CellMask Orange. Scale bar represents 20 µm. (F) Quantification of cell area from images (E). Shown are mean values with 95% confidence intervals from 3 independent experiments for 30min timepoint or from 2 independent experiments for 120 min timepoint. Sample sizes are given in brackets. Statistical significance was calculated using one-way ANOVA followed by Bonferroni Multiple Comparison Test (ns: not significant; *** p≤0.0001; ** p≤0.01).

Journal: bioRxiv

Article Title: A flexible loop in the paxillin LIM3 domain mediates direct binding to integrin β3

doi: 10.1101/2023.01.26.525744

Figure Lengend Snippet: ( A) Mapping of combined amide CSPs when binding to integrin β3 onto the solution structure of paxillin LIM2/3 shown as surface representation from two perspectives. Residues showing CSPs larger than average δΔ + 3x s.d. are colored red, residues for which [average δΔ + 3x s.d. < δΔ < average δΔ +2x s.d.] are colored orange, and residues for which [average δΔ + 2x s.d.< δΔ < average δΔ + 1x s.d.] are colored yellow. Residues with δΔ < average + 1x s.d. are colored grey. The boxed region is also shown in stick representation including the flexible loop of the LIM3 domain using the same color code. Residues experiencing significant CSPs are labelled by amino acid type and position. (B) Combined amide CSPs of 250 µM 15 N paxillin LIM2/3 in the presence of 750 µM integrin β3 vs residue number of paxillin. Lines indicate average δΔ + 1x s.d. (yellow), δΔ + 2x s.d. (orange) and δΔ + 3x s.d. (red). (C) 15 N-HSQC titration of 250 µM 15 N paxillin LIM2/3 wt (PXN LIM2/3 wt) with integrin β3. Integrin was added in concentrations up to 2420 µM. Boxes show a selection of signals affected by CSPs (residues F480 & F481) in the presence of 0 µM (black), 200 µM (green), 600 µM (blue) and 2420 µM (red) integrin β3 ct. (D) Recombinantly expressed His 6 -SUMO PXN LIM2/3 wt or His 6 -SUMO PXN LIM2/3 4A were pulled down using Twin-Strep-Tag integrin β3 ct. PXN LIM2/3 4A shows reduced binding to integrin β3 ct. (E) Outside-in signalling dependent cell spreading of paxillin knockout cells, stably re-expressing ctrl vector (PXN KO), GFP-paxillin wt (PXN wt) or paxillin mutants PXN ∆LIM4 and PXN-4A. Cells were starved overnight and seeded for 30 or 120 min, respectively on the integrin β3 ligand vitronectin in the absence of serum. Cells were fixed and the cell membrane was stained with CellMask Orange. Scale bar represents 20 µm. (F) Quantification of cell area from images (E). Shown are mean values with 95% confidence intervals from 3 independent experiments for 30min timepoint or from 2 independent experiments for 120 min timepoint. Sample sizes are given in brackets. Statistical significance was calculated using one-way ANOVA followed by Bonferroni Multiple Comparison Test (ns: not significant; *** p≤0.0001; ** p≤0.01).

Article Snippet: For complementation of integrin β3, cDNA of murine integrin β3 (gift from Michael Davidson, addgene plasmid # 54130) was amplified by PCR using the following primers mITGB3 forward: 5’-GATGACACTAGTGACCGCCATGCGAGCGCAGTG-3’ and mITGB3-fl reverse: 5’-TCGGCAGCCCTCGAGCTAAGTCCCCCGGTAGGTGATATTG-3’; mITGB3 forward and mITGB3∆8aa reverse: 5’-TCGGCAGCCCTCGAGCTAGAAGGTGGAGGTGGCCTCTTTATAC-3’; mITGB3 forward and mITGB3∆3aa reverse: 5’-TCGGCAGCCCTCGAGCTAGTAGGTGATATTGGTGAAGGTGGAGGTG-3’.

Techniques: Binding Assay, Residue, Titration, Selection, Strep-tag, Knock-Out, Stable Transfection, Expressing, Plasmid Preparation, Membrane, Staining, Comparison

Figure 3. Th1 cells form FAs. (A–D) Representative migrating Th1 cells expressing Talin-EGFP in confinement on (A) ICAM-1, (B) FN, (C) PLL, and (D) PLL- PEG. (E) Representative image of a confined Th1 cell fixed and stained for endogenous talin. (F and G) Quantification of the number of FA-positive cells when expressing (F) Talin-EGFP or (G) vinculin-EGFP compared across surface treatments. (H) A comparison of FA lifetime between Th1 cells and fibroblasts ex- pressing Vinculin eGFP (representative images on right). (I and J) Representative Th1 cells expressing (I) Talin-EGFP or (J) Integrin β3-Emerald in confinement on a micropatterned substrate. The left portion of the field of view is FN coated and the right portion is passivated. Number of biological replicates (colored dots): (F) Passivated, 36 cells from three experiments; PLL, 53 cells from two experiments; FN, 140 cells from five experiments; ICAM-1, 40 cells from three ex- periments. (G) Passivated, 21 cells from two experiments; PLL, 38 cells from four experiments; FN, 94 cells from four experiments; ICAM-1 169 cells from three experiments. (H) Th1 n = 10; Fibroblast n = 10. Each replicate represents the average turnover of ≥5 FAs per cell. Statistical tests: (F–H) Two-tail unpaired parametric t test was used to compare the replicates.

Journal: The Journal of cell biology

Article Title: T cells use focal adhesions to pull themselves through confined environments.

doi: 10.1083/jcb.202310067

Figure Lengend Snippet: Figure 3. Th1 cells form FAs. (A–D) Representative migrating Th1 cells expressing Talin-EGFP in confinement on (A) ICAM-1, (B) FN, (C) PLL, and (D) PLL- PEG. (E) Representative image of a confined Th1 cell fixed and stained for endogenous talin. (F and G) Quantification of the number of FA-positive cells when expressing (F) Talin-EGFP or (G) vinculin-EGFP compared across surface treatments. (H) A comparison of FA lifetime between Th1 cells and fibroblasts ex- pressing Vinculin eGFP (representative images on right). (I and J) Representative Th1 cells expressing (I) Talin-EGFP or (J) Integrin β3-Emerald in confinement on a micropatterned substrate. The left portion of the field of view is FN coated and the right portion is passivated. Number of biological replicates (colored dots): (F) Passivated, 36 cells from three experiments; PLL, 53 cells from two experiments; FN, 140 cells from five experiments; ICAM-1, 40 cells from three ex- periments. (G) Passivated, 21 cells from two experiments; PLL, 38 cells from four experiments; FN, 94 cells from four experiments; ICAM-1 169 cells from three experiments. (H) Th1 n = 10; Fibroblast n = 10. Each replicate represents the average turnover of ≥5 FAs per cell. Statistical tests: (F–H) Two-tail unpaired parametric t test was used to compare the replicates.

Article Snippet: The empty backbone MIGR1 (a gift from Warren Pear (University of Pennsylvania, Philadelphia, PA, USA), #27490; Addgene) was used to make retroviral constructs to express Lifeact-EGFP, Integrin β3-Emerald, Vinculin-EGFP, and Talin-EGFP (mEGFPLifeact-7 [#54610; Addgene] and mEmerald-Beta3-N-18 [#54130; Addgene] were gifts from Michael Davidson (Florida State University, Tallahassee, FL, USA); pEGFP Vinculin [#50513; Addgene] was a gift from Kenneth Yamada (National Institute of Health, Bethesda, MD, USA); and GFP-Talin1 [#26724; Addgene] was a gift from Anna Huttenlocher (University of Wisconsin, Madison,WI, USA)).

Techniques: Expressing, Staining, Comparison

Figure 4. Th1 cells exert traction stresses at FAs. (A and B) Representative traction maps of a (A) fibroblast or (B) Th1 cell expressing Lifeact-EGFP. The fibroblast is plated on a gel with a shear modulus of 16 kPa, while the Th1 cell is plated under agarose on a gel with a shear modulus of 336 Pa. Both gels are coated with FN. (C) Cartoon illustrating the direction of potential forces (black arrows) and their orientation with respect to the cell centroid (white arrows). (D and E) 2D histograms comparing the magnitude of measured traction stresses and the difference in their direction (θ) from the cell centroid. Pulling (contractile) forces are represented as cosθ = 1, while pushing forces are represented as cosθ = −1. Histograms are shown for (D) fibroblasts and (E) Th1 cells on FN-coated gels. (F) Representative images of a Th1 cell expressing Vinculin-EGFP sandwiched between two acrylamide gels of 460 Pa coated with FN. On the bottom gel, contractile forces (orange arrow) colocalize with vinculin puncta (orange circle). (G) On the top gel, pushing forces (purple arrow) show no co- localization with vinculin (purple circle) and likely arise from the cell pushing the gel out of the way as it is pulled through the gel. (H) 2D histogram comparing the magnitude of measured traction stresses and the difference in their direction from the cell centroid for a cell confined between two passivated gels.

Journal: The Journal of cell biology

Article Title: T cells use focal adhesions to pull themselves through confined environments.

doi: 10.1083/jcb.202310067

Figure Lengend Snippet: Figure 4. Th1 cells exert traction stresses at FAs. (A and B) Representative traction maps of a (A) fibroblast or (B) Th1 cell expressing Lifeact-EGFP. The fibroblast is plated on a gel with a shear modulus of 16 kPa, while the Th1 cell is plated under agarose on a gel with a shear modulus of 336 Pa. Both gels are coated with FN. (C) Cartoon illustrating the direction of potential forces (black arrows) and their orientation with respect to the cell centroid (white arrows). (D and E) 2D histograms comparing the magnitude of measured traction stresses and the difference in their direction (θ) from the cell centroid. Pulling (contractile) forces are represented as cosθ = 1, while pushing forces are represented as cosθ = −1. Histograms are shown for (D) fibroblasts and (E) Th1 cells on FN-coated gels. (F) Representative images of a Th1 cell expressing Vinculin-EGFP sandwiched between two acrylamide gels of 460 Pa coated with FN. On the bottom gel, contractile forces (orange arrow) colocalize with vinculin puncta (orange circle). (G) On the top gel, pushing forces (purple arrow) show no co- localization with vinculin (purple circle) and likely arise from the cell pushing the gel out of the way as it is pulled through the gel. (H) 2D histogram comparing the magnitude of measured traction stresses and the difference in their direction from the cell centroid for a cell confined between two passivated gels.

Article Snippet: The empty backbone MIGR1 (a gift from Warren Pear (University of Pennsylvania, Philadelphia, PA, USA), #27490; Addgene) was used to make retroviral constructs to express Lifeact-EGFP, Integrin β3-Emerald, Vinculin-EGFP, and Talin-EGFP (mEGFPLifeact-7 [#54610; Addgene] and mEmerald-Beta3-N-18 [#54130; Addgene] were gifts from Michael Davidson (Florida State University, Tallahassee, FL, USA); pEGFP Vinculin [#50513; Addgene] was a gift from Kenneth Yamada (National Institute of Health, Bethesda, MD, USA); and GFP-Talin1 [#26724; Addgene] was a gift from Anna Huttenlocher (University of Wisconsin, Madison,WI, USA)).

Techniques: Expressing, Shear

KEY RESOURCES TABLE

Journal: Immunity

Article Title: Programming of distinct chemokine-dependent and -independent search strategies for T helper-1 and Th2 cells optimizes function at inflamed sites

doi: 10.1016/j.immuni.2019.06.026

Figure Lengend Snippet: KEY RESOURCES TABLE

Article Snippet: Immunity 12, 483-494 ( 2000 ) NCCC part# OH794 anti-mouse IL-4 (clone 11B11), purified ATCC Cat# HB-188; RRID:CVCL_9139 anti-mouse IFNg (clone XMG1.2), purified 3.155 monoclonal antibody (anti-CD8) Bio X cell Cat# BE0055; RRID:AB_1107694 J11d.2 monoclonal antibody (anti-CD24) ATCC Cat# TIB-183; RRID:CVCL_9185 M5/114 monoclonal antibody (anti MHCII) ATCC Cat# TIB-120; RRID:CVCL_9215 JIJ monoclonal antibody (anti Thy1.2) ATCC Cat# TIB-184; RRID:CVCL_9186 Bacterial and Virus Strains MSCV- α V shRNA-GFP Dr. Adam Lacy-Hulbert, Benaoya research institute N/A Integrin-Beta3-N-18-mEmerald Dr. Jim Miller, University of Rochester, gift from Michael Davidson Addgene Plasmid # 54130 Control MSCV-GFP Dr. Jim Miller, University of Rochester N/A Chemicals, Peptides, and Recombinant Proteins CellTracker Orange CMTMR Dye Invitrogen Cat# C2927 CFSE (5-(and-6)-Carboxyfluroescein Diacetate, Succinimidly Ester) Invitrogen (Molecular Probes) Cat# C1157 Texas Red 70,000MW Dextran Invitrogen Cat# D1830 Complete Freund’s adjuvant Sigma-Aldrich Cat# F5881 Imject Alum Adjuvant Thermo Fisher Scientific Cat# 77161 OVA peptide (Structure: ISQAVHAAHAEINEAGR-OH) Biopeptide Co., Inc.

Techniques: Purification, Staining, Cell Culture, Virus, shRNA, Plasmid Preparation, Control, Recombinant, Adjuvant, Transgenic Assay, Software, Real-time Polymerase Chain Reaction